
Features
Free and open-source MATLAB library for the virtual element method.
-
- Two-dimensional linear elastostatics (plane strain and plane stress) and two-dimensional Poisson problem.
- Solution methods: Linear VEM (polygonal elements), FEM (3-node triangles, 4-node quadrilateral).
- Boundary conditions: Dirichlet, Neumann on boundary edges; can be a constant or a function.
- Meshers: PolyMesher, distmesh2d, quad4mesh; PolyMesher is customized for rectangular domain, wrench domain and plate with a hole domain; distmesh2d and quad4mesh are customized for rectangular domain only. Domains can be extended for any of the meshers, but it requires adjustments to some interface functions (see the instructions that are available in functions create_polygonal_mesh.m, create_quadrilateral_mesh.m and create_triangular_mesh.m in folder “mesher”).
- Meshes need to be generated separately and saved to folder “test/mesh_files”.
- Meshes must be generated with the functions “create_” located in the folder “mesher”. Then, the files containing the generated meshes will be automatically saved to folder “test/mesh_files” for their use.
- Solutions can be saved to MATLAB figures; plotted and saved to PDF figures; saved to text files, GiD files and VTK files.
First steps
Once the software is downloaded there are two fonts that need to be installed so that the output figures are plotted correctly. If these fonts are not present, MATLAB will use default fonts. These fonts are Segoe UI Semibold and Good Times RG. For Windows systems, these fonts are included in folder “vemlab/utilities/fonts”. The instructions to install these fonts are also provided in the same folder. For completeness, the instructions are also provided here.
Segoe UI Semibold: This font must be installed directly in your operating system. In Windows system this is done in Settings–>Fonts or just type “Font settings" in Window's search utility.
Good Times RG: This font must be added to the Java Runtime Environment (JRE) that ships with MATLAB (if that is the Java version being used by the program). The steps to install the font are:
- Copy the TTF fonts to “C:/Program Files/MATLAB/R2019a/sys/java/jre/win64/jre/lib/fonts". Note: You might need to be an administrator to copy files to this folder.
- Restart MATLAB.
- You should now be able to see the fonts in MATLAB's font preference panel. Note: If using the default JVM shipped with MATLAB, you must do this for each MATLAB version installed.
Plotting of results
Plots can be directly obtained through MATLAB’s figures by setting the following parameters in function “plot_and_output_options.m” that is located in folder “config”:
create_matlab_contour_plots='yes'; % (for numerical solution)
create_matlab_exact_contour_plots='yes'; % (for exact solution)
The figures can also be printed and saved to PDF files (the output PDFs are saved to folder “test/output_files/matlab_figures/”) by setting
print_figures='yes'; % (for numerical solution)
print_exact_figures='yes'; % (for exact solution)
The figures can also be saved to .fig files (the output .fig files are saved to folder “test/output_files/matlab_figures/”) by setting
save_matlab_figures='yes'; % (for numerical solution)
save_exact_matlab_figures='yes'; % (for exact solution)
The resolution of the MATLAB’s figures when plotting to PDF files or saving to .fig files is controlled by
print_figures_resolution=600;where it has been set to 600 dpi. This value can be changed as required by the user.
Many other customizations of the output figures can be made by setting the appropriate parameters in “plot_and_output_options.m” (for details, see the manual that is located in folder “doc”). Several example output MATLAB’s figures are provided in the manual.
As an alternative, plots can be visualized externally in the GiD postprocessor. This is an independent process and can be performed even if plots were set to be displayed on MATLAB’s figures. When the following is set in “plot_and_output_options.m”:
write_solutions_to_GiD_file='yes';results are written to GiD files and saved to folder “test/output_files/GiD”. GiD can be downloaded from its webpage: https://www.gidhome.com/.
Running VEMLAB
VEMLAB is a library. You need to create a main .m file and place it inside the folder “test”. The main file has the typical structure of a FEM simulation. Simply follow the test problems (they are given with detailed comments) that are provided inside the folder “test” to write your own .m files or modify the ones provided. Alternatively, you can read the manual that is available in the folder “doc”.
Running VEMLAB in Octave
We are grateful to Dr. Stefan Holst, EMAG Application Manager, Technology Group, CD-adapco/Siemens PLM Software, for his kind advice on making VEMLAB to run in Octave.
In Octave, the “computer” function that is at the beginning of each test file, returns a different name than one of those expected by VEMLAB when running in MATLAB, i.e., 'PCWIN', 'PCWIN64', 'GLNX86' or 'GLNXA64'. To fix this, at the beginning of each test file simply redefine the variable “opsystem” as follows: opsystem='PCWIN' or opsystem=' GLNX86' if the machine where Octave is installed is a Windows machine or a Linux machine, respectively.
In addition, Octave presents some issues when plotting VEMLAB results to MATLAB figures (on small meshes it will do the work, but on larger meshes it will crash). To fix this, switch off all the MATLAB figures by setting the following parameters in the function “plot_and_output_options.m” that is in the folder “config”:
create_matlab_contour_plots='no';
plot_mesh='no';
plot_mesh_over_results='no';
write_solutions_to_text_file='yes';
write_solutions_to_GiD_file='yes';
write_solutions_to_VTK_file='yes';
Make sure the last three parameters are set to 'yes' so that one can have access to VEMLAB results through text files or can postprocess results in GiD and VTK/Paraview.
Author
Alejandro Ortiz-Bernardin – Associate Professor, Department of Mechanical Engineering, Universidad de Chile.
License
This project is licensed under the GPL3 License. This program is free software; it can be redistributed or modified under the terms of the GNU General Public License 3 as published by the Free Software Foundation.
Download
>> Latest stable version of VEMLAB (24-JUNE-2022): VEMLAB 2.4.1
Manual: VEMLAB Primer (PDF manual)
GitHub: Browse the source code | Download the source code
>> From VEMLAB 2.4 to VEMLAB 2.4.1:
- Fix some bugs in create_polygonal_mesh.m
- Fix several bugs in the writing of output files. Affected functions:
postprocess_numerical_solution_linelast2d.m
write_solution_txt_linelast2d.m
plot_numerical_solution_poisson2d.m
postprocess_numerical_solution_poisson2d.m
write_solution_CPP_poisson2d.m
write_solution_txt_poisson2d.m
write_solution_GiD_poisson2d.m - Optimize function T3toPolyMesh.m
>> From VEMLAB 2.3 to VEMLAB 2.4:
-
-
- Add several options in “plot_and_output_options.m". New options: delete existing output files, plot front/isometric view of the figure, print and save pdf figures, save .fig figures, set figure resolution, color system for the colorbar, colorbar ticks and lines, figure ticks, figure grid, set min/max limit of the colorbar.
- Several enhancements to the output figures.
- Improvements for plotting of FEA results on FEM2DQ4 elements.
- Add several example test problems in “test" folder.
- Create a polygonal mesh from a 3-node triangular mesh (see folder “mesher").
- Three stabilization options are now available in LinearElastostatics module.
- Mesh size parameter is now computed as the average area of the polygons in the mesh.
- Update VEMLAB Primer.
-
>> From VEMLAB 2.2.2 to VEMLAB 2.3:
-
-
- Add possibility of using multiple materials in the Poisson module.
- Update triangulate_polygon function so that it uses the built-in triangulation matlab function.
- Bug fix in writing to txt file.
- Add possibility to write output files suitable to be read in Convex Polygon Packing (CPP) program.
- Add some options for controlling the plotting of the mesh (plot_mesh_linewidth, plot_mesh_nodes, plot_mesh_nodesize, plot_mesh_axis).
- Add sparse solver to VEM2D/FEM2D in LinearElastostatics and Poisson modules.
- Remove L-shape example from the test folder due to bad behavior in plotting stresses and strains.
-
>> From VEMLAB 2.2.1 to VEMLAB 2.2.2:
-
-
- Fix function max_edge_size.m.
- Add an L-shape example in the test folder.
- Update calculation of the polygon's area: MATLAB's “polyarea.m" is now used.
-
>> From VEMLAB 2.2 to VEMLAB 2.2.1:
-
-
- Add option to explicitly switch off all MATLAB figures in function “plot_and_output_options.m".
- Facilitate compatibility to run VEMLab in Octave.
- Update manual with a guide to running VEMLab in Octave.
-
>> From VEMLAB 2.1 to VEMLAB 2.2:
-
-
- Fix disp() in plot_and_ouput_options.m: disp(“Hello") seems to work only in newer versions of MATLAB. So, it is changed to the standard MATLAB format disp('Hello').
- Results that are postprocessed in the graphical user interface of GiD are now ordered in folders.
- Add option to plot deformed domain in MATLAB figures when using the LinearElastostatics module (see function “plot_and_ouput_options.m” located in the folder “config”).
- Add a function to read a meshfile having the domain type declared as “Custom", which is useful for defining the meshfile manually or using an external mesh generator or using a customized version of the mesh generators available in VEMLAB. (See example “Creating and using a custom meshfile" in the VEMLAB Primer or details.)
- Add more details to the VEMLAB Primer.
-
>> From VEMLAB 2.0.2 to VEMLAB 2.1:
-
-
- Add customized wrench domain (for PolyMesher mesh generator only).
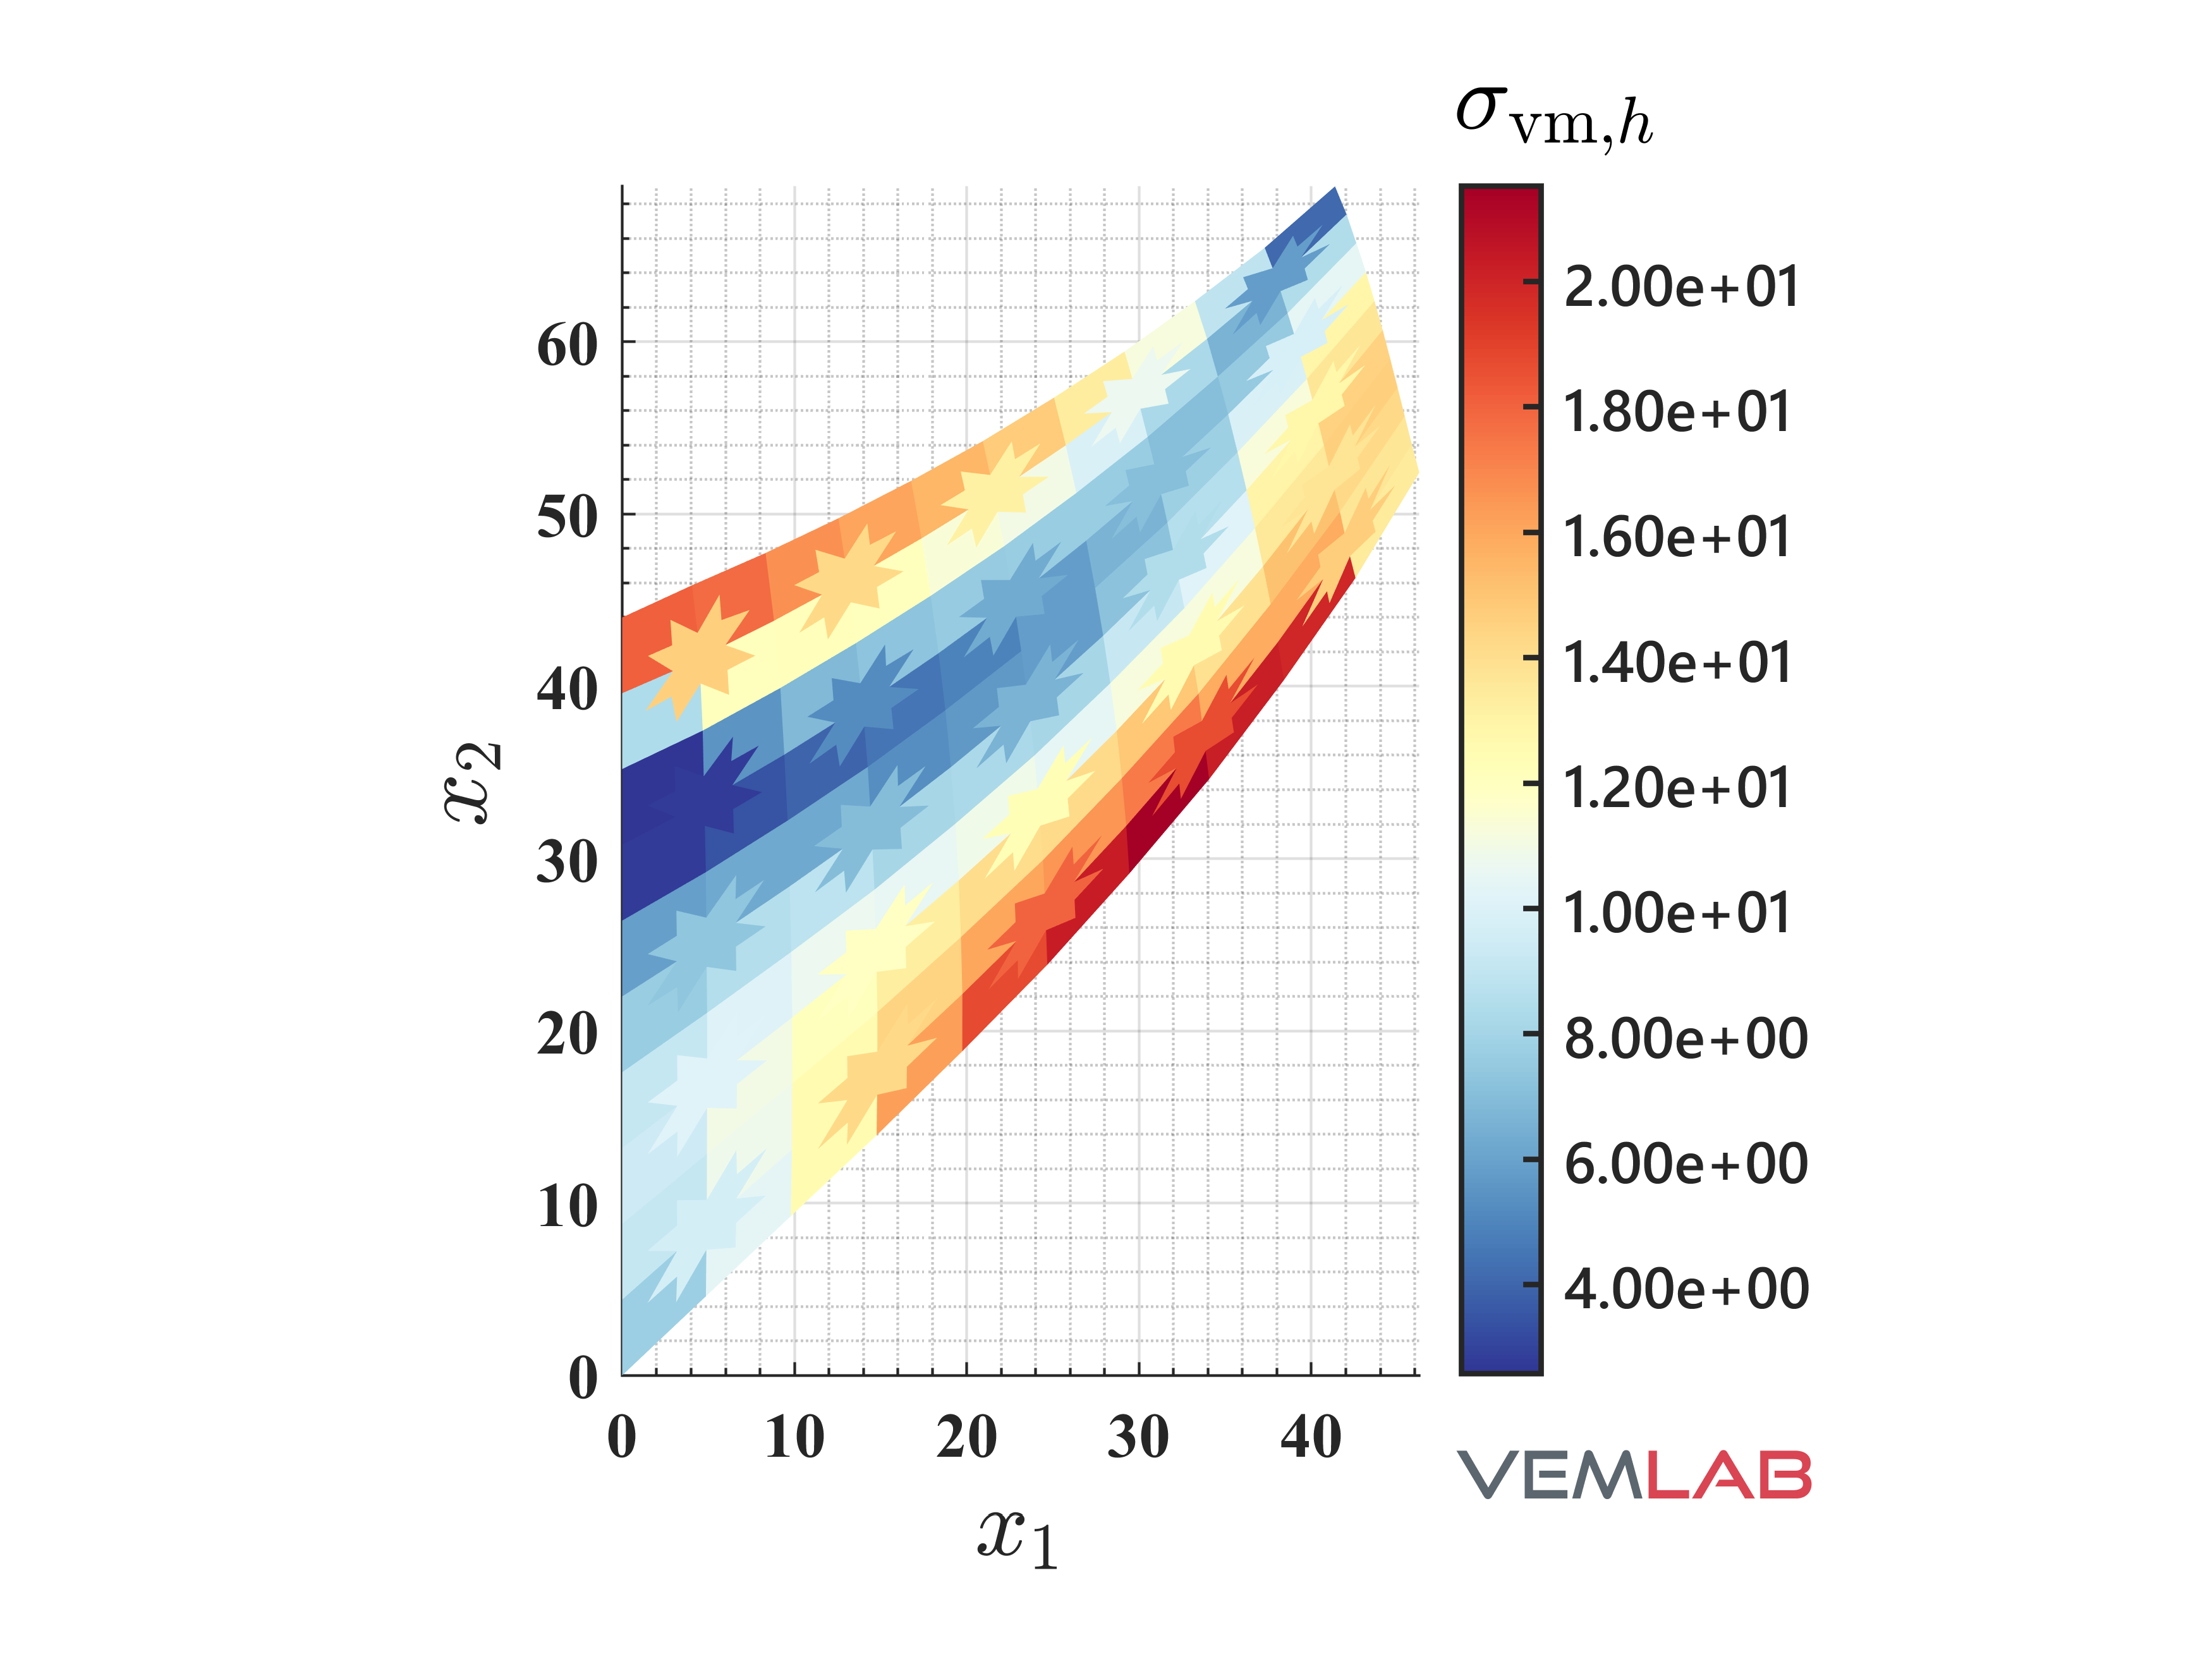
- Add customized plate with a hole domain (for PolyMesher mesh generator only).
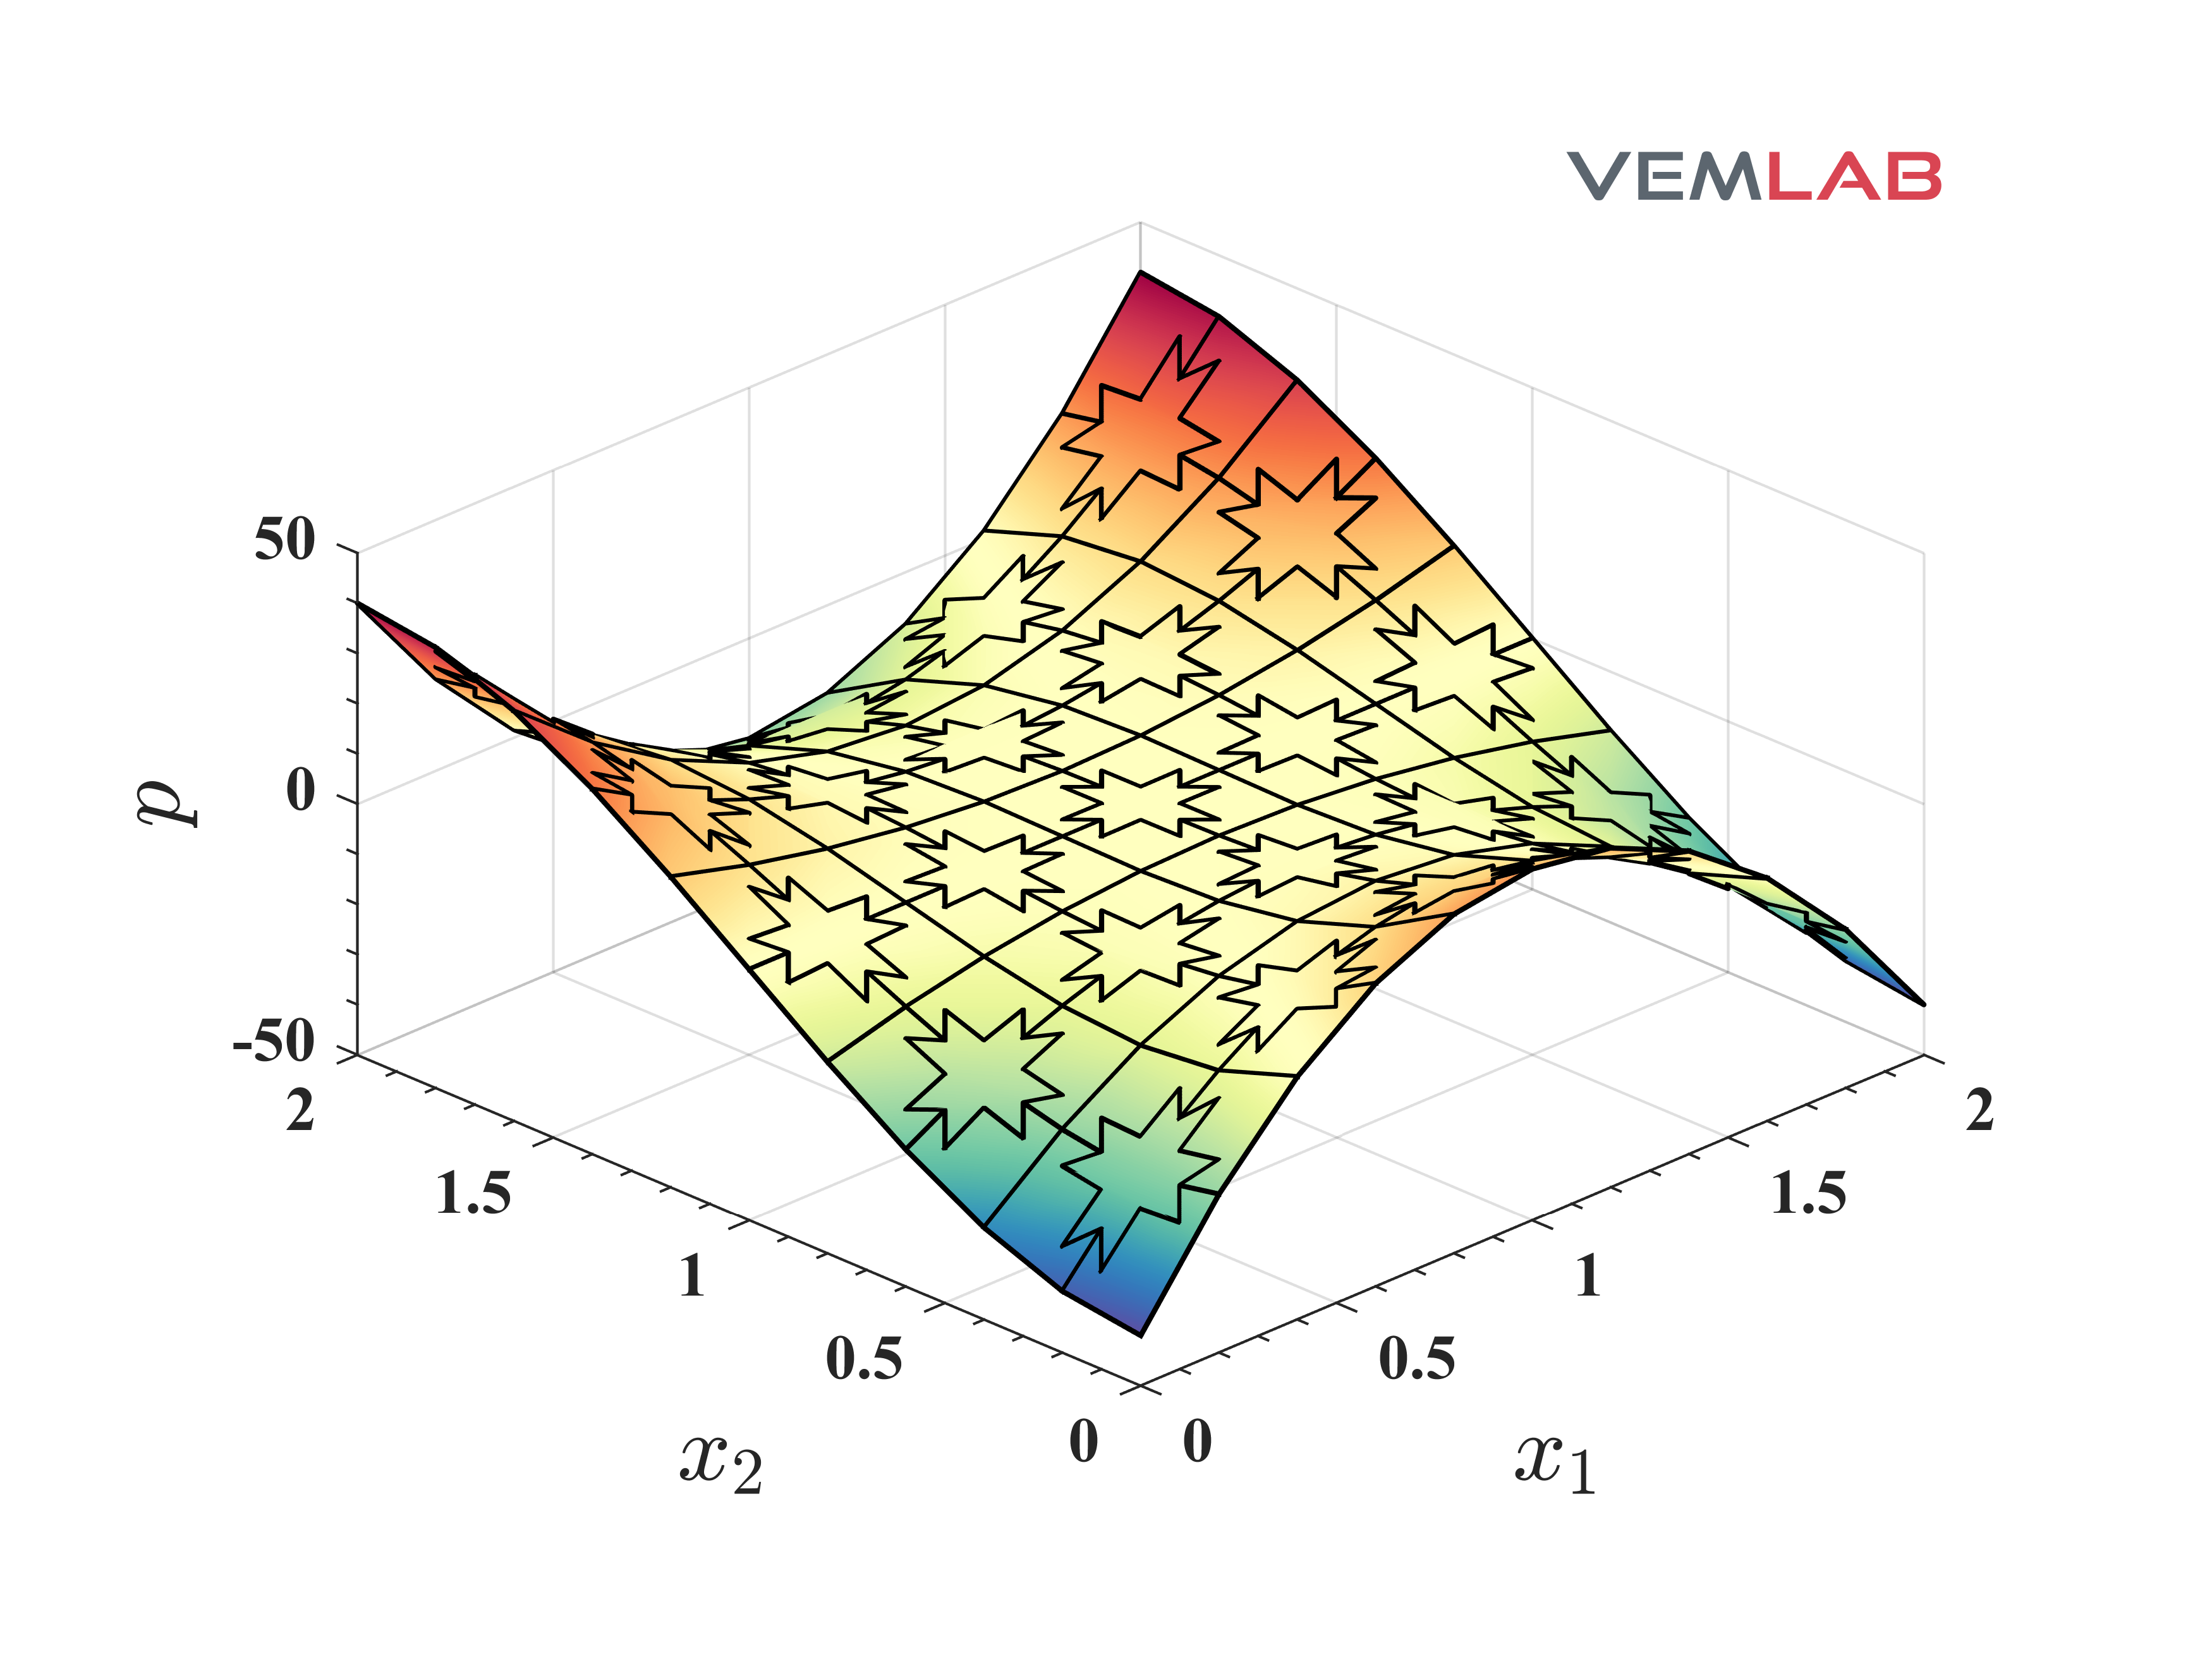
- Add the following test: “square_plate_with_source2_poisson2d.m" in test folder.
- Add the following test: “plate_with_hole_linelast2d.m" in test folder.
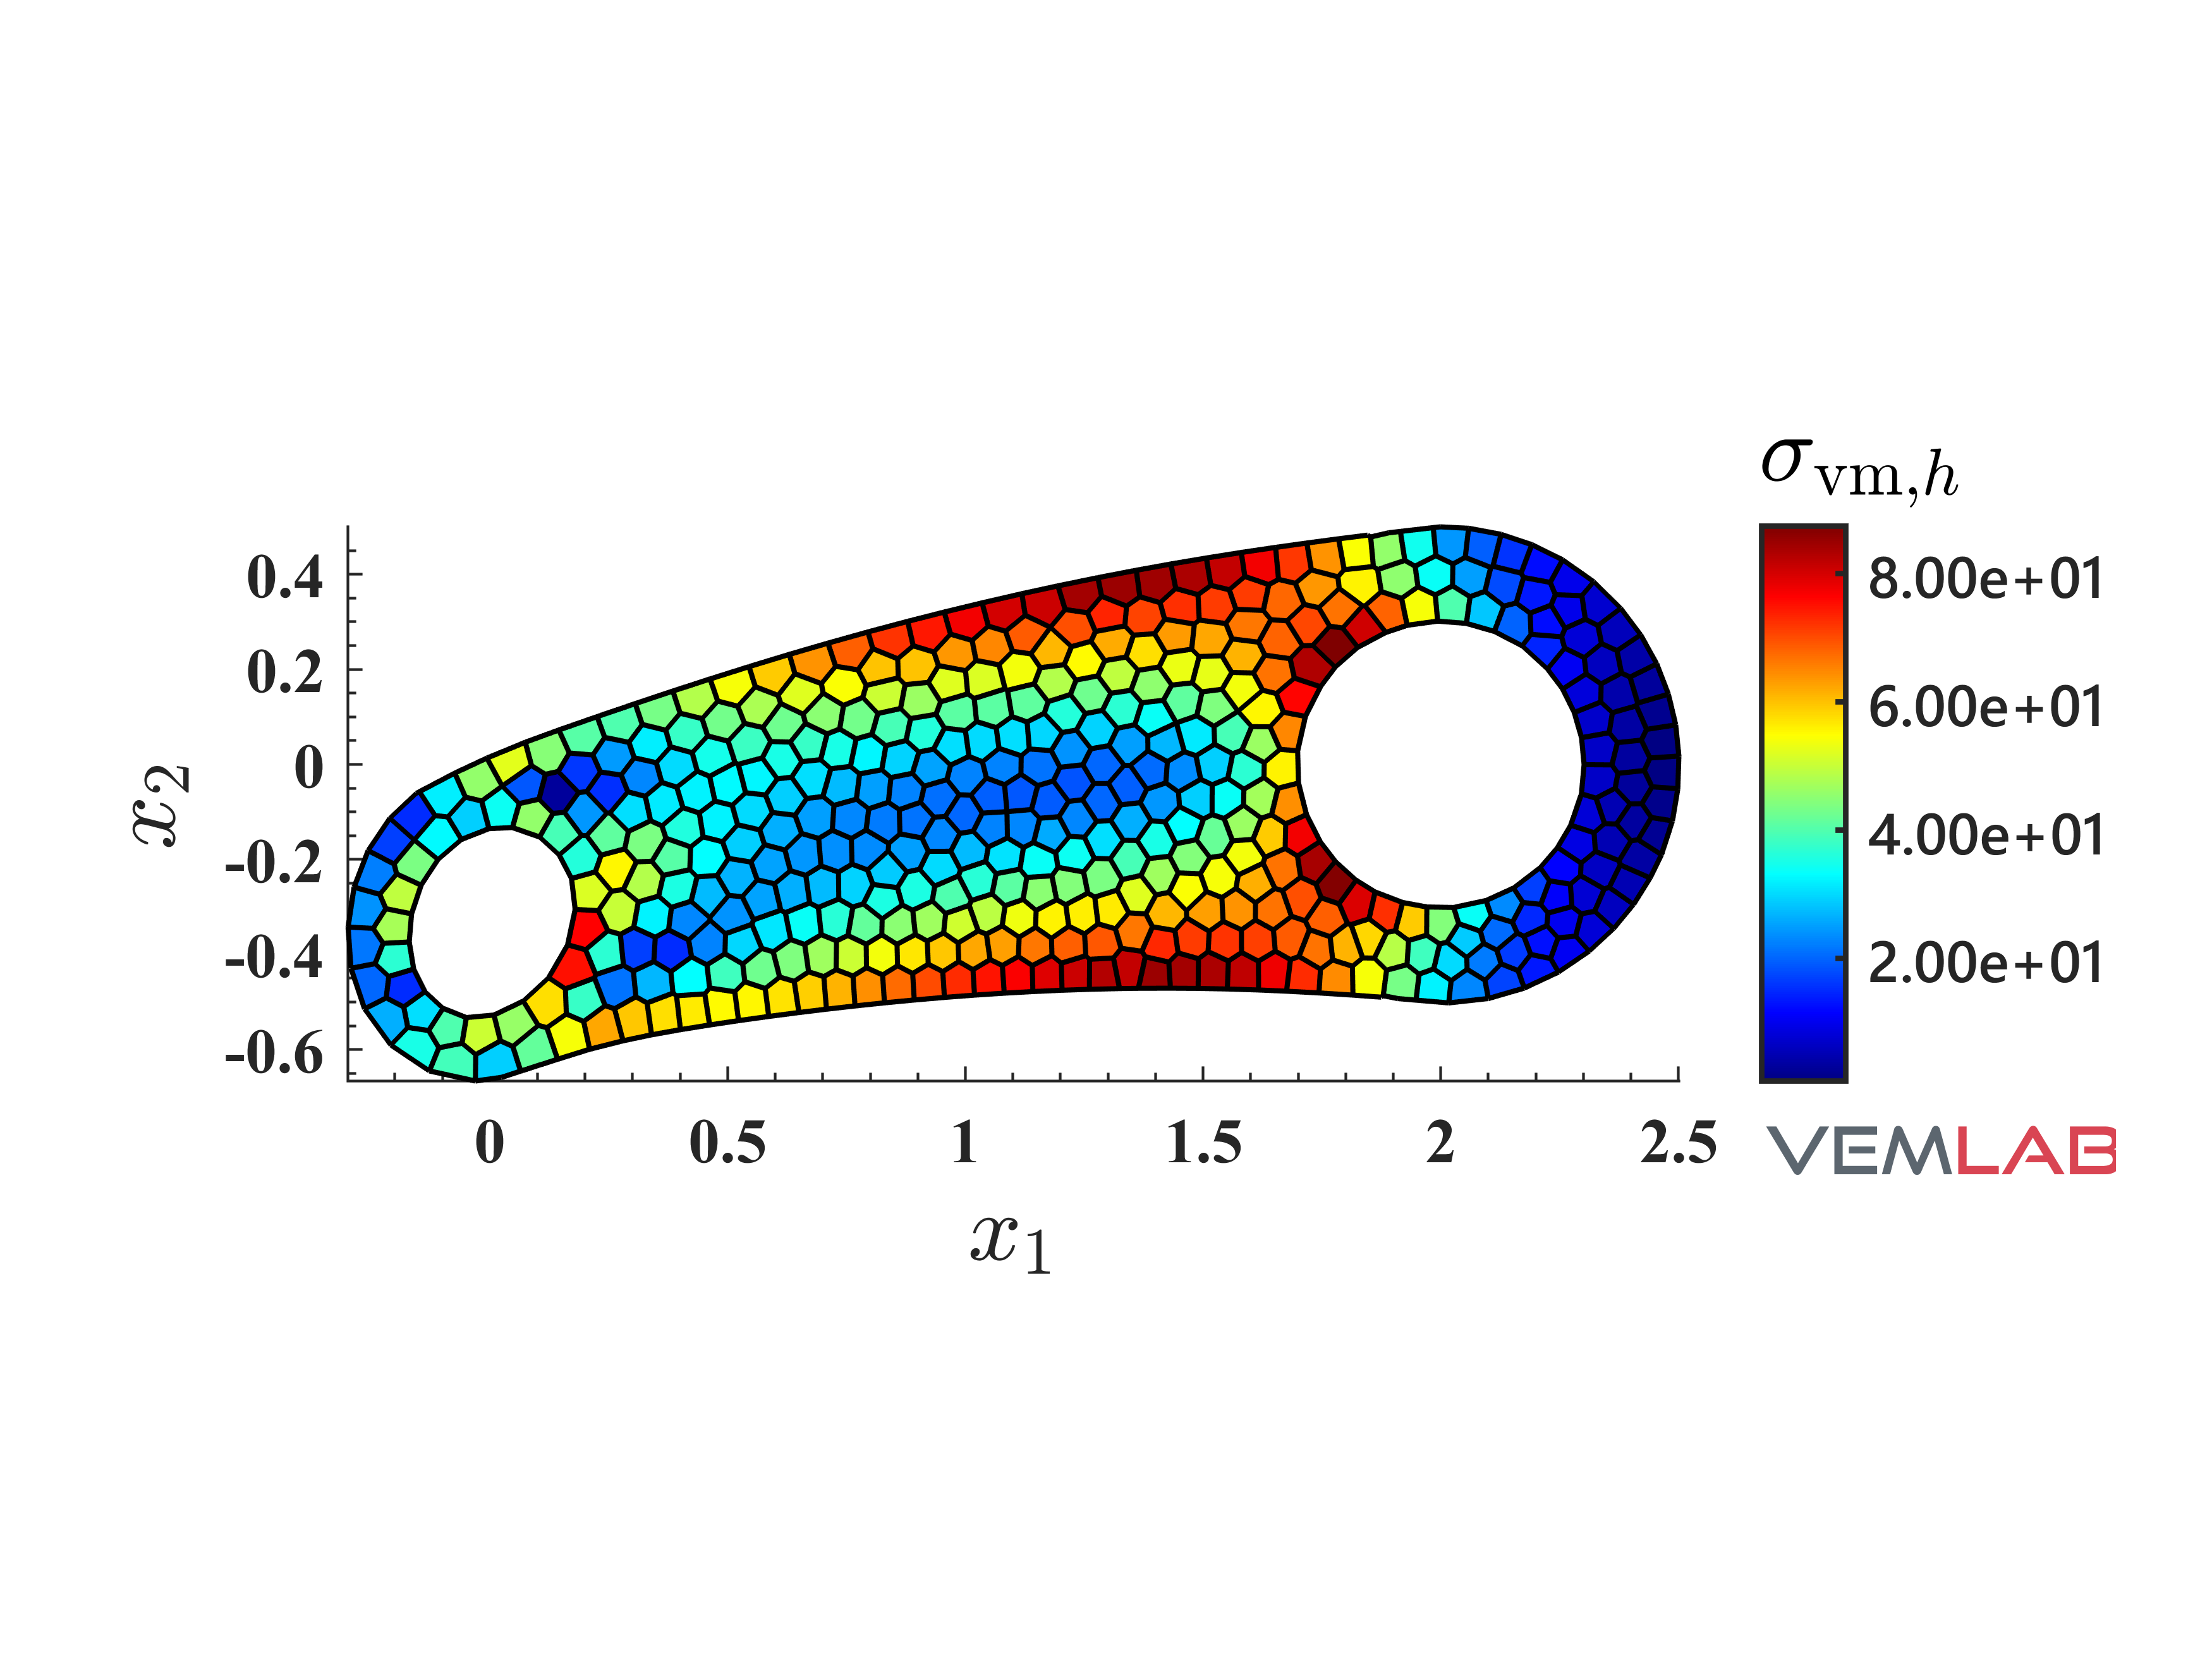
- Add the following test: “wrench_linelast2d.m" in test folder.
- Fix iteration counter in PolyMesher function.
-
>> From VEMLAB 2.0.1 to VEMLAB 2.0.2:
-
-
- Fix several bugs when using vemlab_method='FEM2DQ4' and vemlab_method='FEM2DT3'.
- Add a control variable in config.m that permits to explicitly set the number of Gauss points to integrate the FEM2DQ4 stiffness matrix and body force vector.
-
>> From VEMLAB 2.0 to VEMLAB 2.0.1: the following features have been added
-
-
- More detailed manual in folder “doc".
- Improvement to the plotting of axis and fonts in MATLAB figures.
-
>> From VEMLAB 1.0 to VEMLAB 2.0: the following features have been added
-
-
- Two-dimensional Poisson problem
- Setup of plot and output options in function “plot_and_output_options" located in folder “config".
- Additional plotting options (stresses, strains, fluxes and gradients) to MATLAB figures, text files and GiD files.
- Option to plot solutions to VTK files.
-
>> VEMLAB 1.0: (Initial release of code)
-
-
- Two-dimensional linear elastostatics (plane strain and plane stress)
- Solution methods: VEM (polygonal elements), FEM (3-node triangles, 4-node quadrilateral)
- Boundary conditions: Dirichlet, Neumann on boundary edges; can be a constant or a function.
- Meshers: PolyMesher [1], distmesh2d [2], quad4mesh; customized for rectangular domains only (requires adjustments for other domain types)
- Meshes need to be generated separately and stored inside folder “mesh_files" located in the folder “test".
- Meshes must be generated with the functions “create_" located in the folder “mesher".
- Solutions can be plotted to MATLAB figures, text files and GiD files.
-